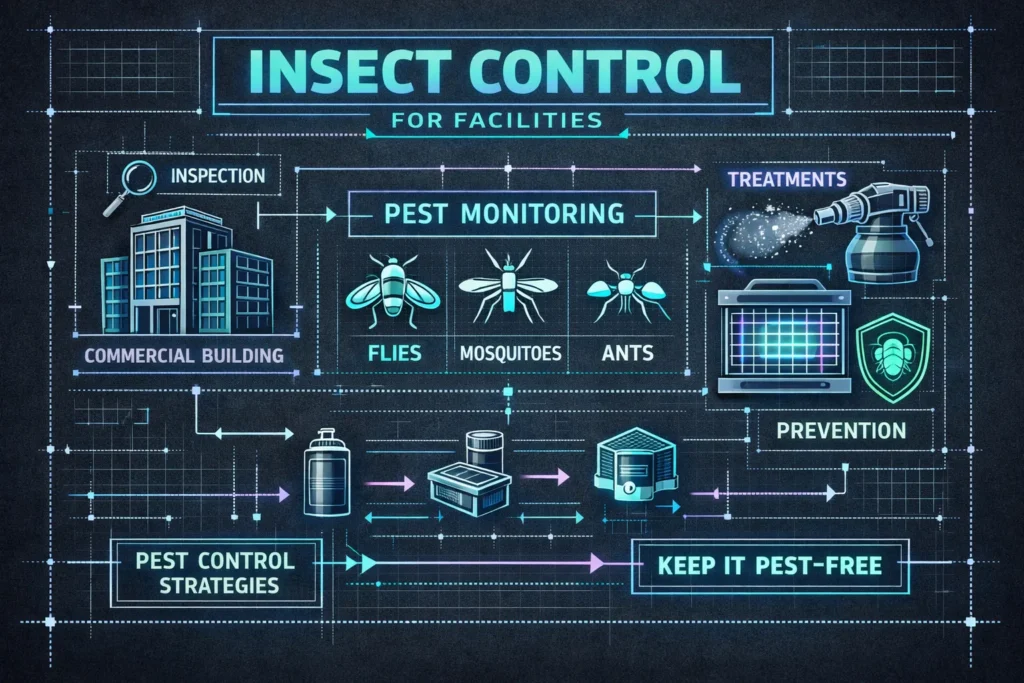
Facility Manager’s Guide to Commercial Insect Control – Pest control is like insurance for your product and your brand. At Bug Managers, we ask three fast questions: What pests matter here? What method fits the problem? Who will document it so you pass audits? This guide provides clear answers and actionable steps to help facility managers implement effective, documented insect control programs and maintain compliance with health and safety standards.
Start with risk: which pests actually cost you money
Not every sighting is equal. A lone fly at the loading dock is different from a roach under a prep table. Prioritize by likelihood × impact. Score each pest on a 1–3 scale for how likely it is, and 1–3 for the consequences. Multiply. A 7–9 is urgent.
Cockroaches — Risk: vectors of food contamination, pathogens, and failed audits. Quick evidence: live adults or nymphs in food zones; pepper‑grain droppings or smear marks; egg cases or grease trails in equipment crevices.
Flies — Risk: rapid pathogen transfer and visible contamination that triggers complaints. Quick evidence: persistent adult swarms near doors or waste; fly specking on exposed product; breeding sites in drains or trash enclosures.
Ants — Risk: colony recruitment that contaminates packaged goods and spreads fast. Quick evidence: scent trails or lines to food; clustered worker activity around packaging; satellite nests in wall voids or equipment bases.
Stored‑product pests (moths, beetles) — Risk: direct product loss, contamination with webbing/frass and costly recalls. Quick evidence: webbing or larvae in bins; frass in corners; adults near inventory or in packaging.
Termites — Risk: structural damage and long‑term repair costs, often invisible until severe. Quick evidence: mud tubes, hollow‑sounding wood, discarded wings near entry points.
Translate sightings into an RFP priority list by noting: pest, exact location, evidence type, immediate exposure risk, and desired response (contain, treat, fumigate). Example trigger: any live roach in a prep or packing area = same‑day escalation.
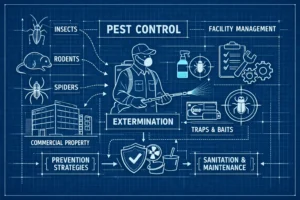
Match the method to the menace: IPM first, then tools
IPM in one line: prevent entry, monitor relentlessly, treat precisely. Start with exclusion and sanitation. Treat only when monitoring or clear evidence demands it.
Baits — Best for ants and cockroaches. Pros: targeted, low residue, colony impact. Downside: slower action; requires technician placement out of reach. Compliance: follow label and exclude food contact surfaces.
Residuals — Best for perimeter control and crack‑and‑crevice work. Pros: fast knockdown and residual protection. Downside: possible resistance and residues if overused. Compliance: label directions, re‑entry limits, and food‑area prohibitions.
Fogging — Best for transient, heavy flying‑insect pressure in non‑production spaces. Pros: rapid adult reduction. Downside: limited penetration into harborage; short residual. Compliance: vacate treated zones and protect sensitive areas.
Fumigation — Best for severe stored‑product infestations and full‑structure eradication. Pros: penetrates hidden commodities. Downside: disruptive, costly, requires evacuation. Compliance: certified applicator and strict pre‑notification protocols.
UV and pheromone traps — Best for continuous monitoring of flying pests in food zones. Pros: chemical‑free, audit‑friendly records. Downside: limited to phototactic species; maintenance required.
Heat treatments — Best for isolated, heat‑tolerant infestations (bed bugs, some stored pests). Pros: non‑chemical, kills all life stages. Downside: costly, logistics heavy; not for entire warehouses without planning.
Exclusion and sanitation — Always the first line. Fix drains, seal dock gaps, improve waste handling. If you can fix it with exclusion + sanitation, do that first; if not, use targeted treatments with documented follow‑up.
Insist on licensed applicators whenever restricted products, fumigation, or perimeter residuals enter production areas. Require non‑chemical alternatives (traps, exclusion) for spaces that handle exposed food or have strict VOC limits.
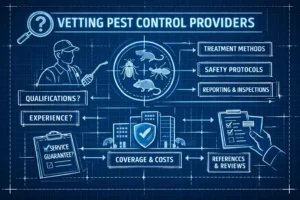
Pick a partner: credentials, red flags, and what to demand
Turn vendor selection into objective criteria. Non‑negotiables:
- Licensed pesticide applicators on site and commercial business license
- Proof of insurance and current Certificates of Insurance
- Access to MSDS/SDS for all products used and a written IPM plan
- Audit‑ready digital reports with time‑stamped service logs and photos
Desirable: QualityPro food‑safety credential, HACCP/GMP awareness, and staff trained on pest management in food facilities. Auditors will ask for applicator certificates, pesticide labels, service logs, trap maps, and exclusion work records—get those in the contract. For facility standards and expectations, follow recognized pest management standards for food processing. If you need quick clarifications on documentation or common auditor questions, see our FAQ, Bug Managers.
Red flags: vague service descriptions, refusal to show applicator certificates, one‑size‑fits‑all chemical programs, no written guarantees, or paper logs only. A premium provider delivers an IPM plan, pest‑proofing proposals (see our Pest & Wildlife Proofing Services), and searchable digital logs. For example, Bug Managers combines licensed technicians, eco‑friendly IPM, pest‑proofing plans, and audit‑ready digital logs—documented outcomes, not excuses. If you’re evaluating local help, consider our regional work such as Pest Control Services in Milton by Experts | Bug Managers as a sample of on‑the‑ground capability.
Contracts and costs: models, sample numbers, and negotiation levers
Common models: one‑time remediation, monthly preventive plans, quarterly checks, and annual bundled contracts. Choose by risk: one‑offs for emergencies; monthly for high‑risk food handlers; quarterly for low‑pressure sites.
| Contract Type | Use Case | Price Anchor |
|---|---|---|
| One‑time remediation | Acute infestations or pre‑audit blitz | $500–$1,500 |
| Monthly preventive | Food processors, restaurants | $40–$100 per visit |
| Per‑sq‑ft pricing | Large warehouses or multi‑site rollouts | $0.25–$0.75 / sq ft |
Negotiation levers: pilot a single site first; require performance milestones and a first‑time‑fix guarantee; cap emergency response fees; require a transparent chemical list; ask for volume discounts for multi‑site programs. For guidance on pricing approaches and how other businesses set service fees, consult this pest‑control pricing guide. Push for contract clauses that matter: same‑day response for health hazards, next‑business‑day for non‑urgent calls; digital reporting cadence (weekly or monthly) with photo evidence; and a warranty window with clear remediation terms.
Measure outcomes: a simple IPM monitoring plan and KPIs
Practical plan: baseline survey to map hotspots; strategic trap placement (docks, waste rooms, production lines); scheduled inspections and logged trap counts; clear action thresholds; monthly trend reports that drive decisions.
Core KPIs to track: trap‑count trend (aim downward over time); first‑time‑fix rate (target >85% where realistic); median response time to service requests; inspection pass rate; and reduction in complaint calls. Read trendlines, not snapshots. A single high trap count in one week is data; three weeks of rising trap counts is a problem. For examples of measurable KPIs and tracking approaches, review practical resources on pest control KPIs.
Executive monthly report — three numbers and one chart executives will read: percent change in trap counts month‑over‑month; FTFR; average response time, plus a 3‑month trendline of trap counts by zone. Use targets as internal goals and normalize by pest and facility risk. For multi‑site programs roll up trap‑count trends to spot repeating trouble locations.
Onboard and review: the 90‑day playbook and renewal decision
Day 0–7: initial survey, urgent containment, and immediate corrections for critical sanitation or exclusion issues.
Day 8–30: deploy monitors, begin sanitation and waste‑management fixes, train the internal pest champion on basic checks.
Day 31–60: optimize placements, seal entry points identified in the survey, and tune treatment plans based on trap data.
Day 61–90: evaluate KPIs, run the joint review meeting, and decide renewal. Metrics met? Fewer sightings? Audit pass? Renew. If not, escalate remediation or re‑bid the work.
Onboarding checklist for facilities: assign an internal pest champion; schedule waste and sanitation fixes; set reporting cadence and access to digital logs; document responsibilities for exclusion work and sign off on initial actions so both parties confirm completion.
Decision gates must be metric‑driven. If trap counts, FTFR, and inspection pass rates hit agreed targets by day 90, move to an ongoing plan. If not, require a corrective action plan or open the contract for competitive rebidding.
Choose prevention over panic. Hire a partner who documents outcomes, not excuses. If you want an audit‑ready partner that combines IPM, fast response, and clear KPIs, Contact, Bug Managers to discuss site pilots, reporting demos, and scoped quotes.